| erlangerchartroom tm ADVANCED ANALYSIS WITH THE SQUEEZEPLAY ADVANTAGE |
|
|
|||||
| Phil Erlanger Research
presents Erlanger Chart Roomtm |
Trading SeasonalityIntroduction
Wall Street research is fraught with techniques to aid traders and investors in the pursuit of the Holy Grail – a set of indicators that will guarantee a steady return. Some of these techniques truly add value, some don’t. The problem is that the stock market is a non-linear environment; the factors that influence price action are complex. No single combination of factors exists that perfectly repeats over time. Like life, the factors that influence stocks have infinite possibilities. It is up to each trader to determine which factor to value in the decision making process (a fact that in and of itself adds to the non-linearity of price action.)
Most of Wall Street research indicators are linear attempts to solve a non-linear problem. Some try to turn one factor into a science. Others look at so many factors that any value is lost by the effect of diminishing degrees of freedom. The trader must therefore decide which factors are of most value. We value those factors that are independent of other factors, have a reasonable degree of correlation to price action, and that successfully repeat over time. Perhaps the most misunderstood and least used of these factors is seasonality. Over the years the more we have used seasonality the more we have come to value it as a primary factor in our decision making. Here’s why.
What is Seasonality?
In general, seasonality is some repeatable tendency of a financial instrument to move in relation to a particular influencing factor. That factor could be the time of year, the year of a decade, changes in interest rates, inflation, energy prices, etc. We focus on stock price action and seasonal cycles derived from the time of the calendar year. Seasonal cycles do not cause prices to move a certain way. They simply reflect a measure of tendency. Ongoing price action is influenced by many factors, only some of which occur on a regular, repeated basis. Those factors that regularly cause a stock price to move a certain way at a particular time of the year may or may not be known, but their seasonal influence will show up in the seasonal indicators and can be qualified by several techniques to measure the breadth and consistency of a stock’s seasonal pattern. The trading process typically begins with the prelude of one or more signals from setup criteria, and then the trade is made when the market moves sufficiently in the anticipated direction to set off a trigger indicator. After the entry trade, “monitoring” indicators are used to exit the trade.
Stock price changes are what a trader tries to exploit. At the end of the day the successful trader either buys at a lower price than sold, or sells short at a higher price than covered (buying to close out a short position.) Setup and trigger indicators therefore generate information for either direction of an opening trade (long or short.) Seasonality uncovers those moments when the market or stock tends to rise (a set up for long trades) or fall (a set up for short trades.) The beauty and marvel of seasonality is that it is known so far in advance, and yet still has value as a timing mechanism. We know of no other stock market factor that has this feature. Let’s step through the process of developing seasonal statistics for stocks, and examine how effective they can be for trading purposes.
The Yearly Seasonal Cycle
There are many time periods one could use to create seasonal cycles. In fact, all cycle analysis is in reality an effort to measure seasonality. We could look at 10-year, 20-year, monthly, weekly, daily, even hourly periods in an effort to uncover repeating patterns. For the purposes of this exercise, we will focus on uncovering seasonal patterns associated with daily closing price action over the calendar year.
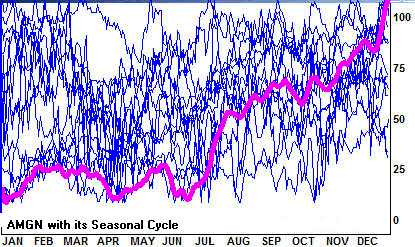
The first step in preparing a seasonal cycle is to chop up the 15-year history of a stock and plot each year starting January 1 through to the end of December. See Figure 1 for a chart of these lines of Amgen (AMGN.) At first brush it looks like spaghetti, or for the more imaginative it might serve as some sort of Rorschach inkblot test. However, by compositing these years into one linear curve (the thick line in Figure 1,) a seasonal cycle is born.
Figure 1 Amgen from 1991 through 2005 spliced up into yearly lines with its seasonal cycle
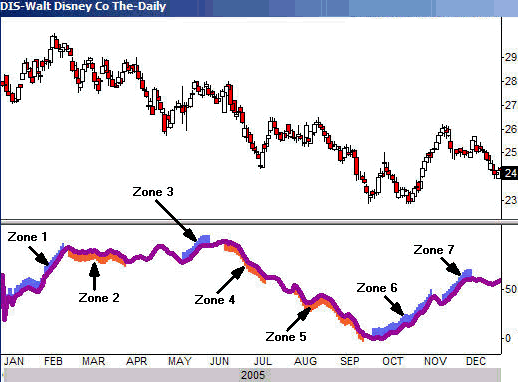
Seasonality Zones Since we are putting our computer to work, let’s have it highlight those 14-day (or longer) periods in the seasonal cycle that are the strongest “zones” and also highlight those 14-day (or longer) periods in the seasonal cycle that are the weakest “zones.”
Figure 2 Disney (DIS) seasonal cycle with seasonality zones
These zones are plotted in Figure 2 for Disney (DIS). In this chart, the seasonal cycle uses a 14-year sample from 1991 to 2004. This particular cycle was created on January 1, 2005 and was not changed in any way as 2005 actually transpired. In other words, the seasonal cycle you see below Disney’s 2005 price action was created using data prior to 2005, and it was up to the price of Disney to follow it or not to follow it. The computer program has added shading to highlight the seasonality “zones.” Shadings above the seasonal cycle (colored blue) represent the strongest seasonal periods of 14-days or longer. Shadings below the seasonal cycle (colored orange) represent the weakest seasonal periods of 14-days or longer. Note how the price of Disney moved during 2005 relative to these “zones.”
Seasonal Heat
We have discussed seasonal cycles, but the fact of the matter is that they are simple guidelines to past behavior during specific periods. Seasonal cycles are composites of past price action, and as such they “hide” measures of seasonal consistency throughout the price action’s history. Our “seasonal heat” process is designed to address the need to measure seasonal consistency.
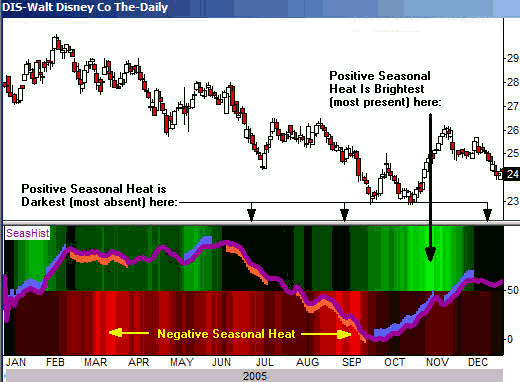
At the beginning of each New Year the seasonal cycle is updated with new seasonality zones, incorporating information from the just completed prior year’s data. While these seasonality zones do not appear precisely at the same time intervals each year, they typically do not deviate greatly from past years. This is at least the case for stocks that have strong seasonal tendencies. The key is to identify those moments in time when seasonality zones of prior years most often occur. For any given day of the year, the more frequently seasonality zones have occurred in past years, the greater is the “seasonal heat” (in our charts seasonal heat is greatest when the background coloring is brightest.) Seasonal heat can be either positive or negative. Positive seasonal heat is a greater number (brighter green background color above the 50% line in the charts.) Negative seasonal heat is a greater negative number (brighter red background color below the 50% line in the charts.)
Figure 3 Disney with Seasonal Heat Map
Figure 3 shows the Disney chart with the seasonal heat map added. Positive seasonal heat is shown above the horizontal mid-line; negative seasonal heat is shown below the horizontal mid-line line. Looking at the heat map above the horizontal mid-line line, the brightest green sections correspond to those periods most frequented by strong seasonal zones in prior years. This illustrates the consistency of seasonality. The more a seasonal pattern repeats, the more likely it is to occur in the future. This is true for strong and weak seasonal patterns. Moreover, those periods in a seasonal map during which the positive seasonal heat is absent (darkest) are potentially riskier moments for Disney than other times of the year.
Deploying Seasonality as Part of an Overall Strategy
Seasonality is a powerful technique that portfolio managers should employ. However, no one factor ought to dictate strategy. A sound strategy uses setup indicators and trigger indicators, and follows up with a reliable monitoring mechanism to aid in exiting trades. Seasonality is primarily a setup mechanism. Other setup mechanisms include (but certainly are not confined to) measures of sentiment. For instance, the observation of short sellers can uncover moments in time when either the bulls or the bears are particularly at risk from contrary move – hence the setup. Let’s return to our example of Amgen to illustrate the point.
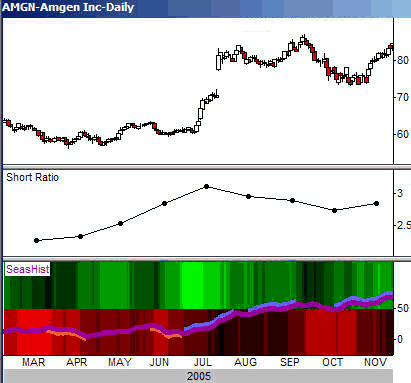
Figure 4 Amgen (AMGN) with short ratio and seasonal patterns
Figure 4 highlights two factors that show Amgen may be set up for a 3rd Quarter 2005 buying opportunity. The seasonal curve turns up on June 24, initiating a positive seasonal zone. Seasonal heat is also very positive. In addition, the short interest ratio has swelled significantly during 2005 heading into this positive seasonal period. Clearly these short sellers are either unaware of or are ignoring the seasonal tendencies of Amgen. In a matter of days from the strong seasonal zone that started on June 24, 2005, Amgen took off, activating any short-term trigger indicators one might employ. The ensuing “short squeeze” included a huge gap to the upside and peaked 87 days later on September 19, 2005, just days after the completion of the second strong seasonal zone. This action handed the bulls a 40.53% gain.
Conclusion Seasonality is a phenomenon that is measurable, but it is not a causal factor. Seasonal cycles do not cause markets to move. They are rather a function of other factors, known or unknown, which over and over again influence the direction of stock prices. We believe that if traders limit their trading to those periods where seasonal tendencies are consistent, the chances of post “trigger” success are better than otherwise.
|
Privacy Policy | Terms of Service | Earnings Disclaimer |
© Phil Erlanger Research Co., Inc., 2026.
All Rights Reserved.


