Do you use charts to help you decide whether to buy or sell a stock?
If so, then your choice is simple. Once you try Erlanger Chart Room for individual investors, (much like the video music aficionados of the 1980s who stated “I want my MTV”,) you will join numerous traders who state “I want my ECR!!!”
What is Erlanger Chart Room (ECR)?
Simply put: A charting and research system that enables you view markets, stocks, groups and sectors from Phil Erlanger, the editor of www.goodmorningwallst.com and Phil Erlanger Research, Inc.

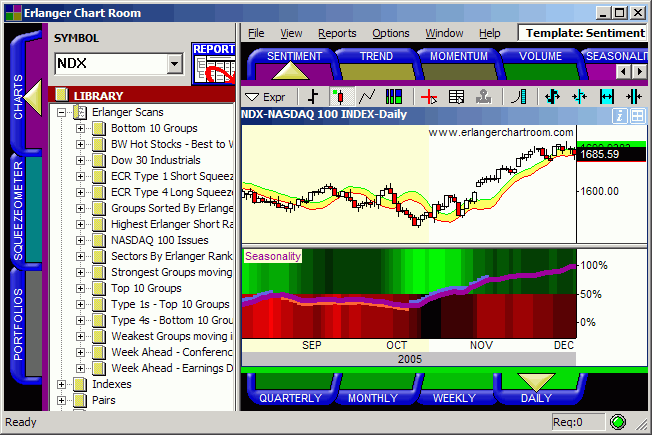
Phil Erlanger's invaluable insights and perspectives can now be harnessed inside of the easy to navigate Erlanger Chart Room for the individual investor. The above chart shows just one such perspective: the seasonality data shown was created and plotted at the beginning of 2005 - the actual price movement closely followed this data.
Who influences stock prices on a day to day basis?
Twenty years ago the Mutual Funds, Pension Plans and Investment Advisors controlled the fate of stock prices. No longer. Yesterday’s big boys have taken a back seat to a new group of investors.
In 2005, Hedge Funds, Proprietary Sell-side Trading Desks and Even Corporations like Intel are the Masters of The Universe. The good news is that there is a plethora of data available to track their movements. The core of our research involves:
- Taking data available to the general public and crunching it through our computers.
- Turn it into information.
- Take that information into knowledge.
The end result is we improve the success rate of our clients.
Hedge Fund assets have grown in the past ten years from $100 billion to over a $1 Trillion. Hedge Funds buy and sell stocks much more aggressive than most traditional managers. This is no longer the type of market investors were used to 20 and even 10 years ago.
Hedge funds short stocks and cover short positions constantly. They use options to get greater leverage with their portfolio. The world has changed over the past twenty five years and now it is time to update your charting software so that you can survive and prosper in the 21 st Century!!
Picking winning trades only gets easier and easier with ECR!
Example -
Amgen (AMGN) breaks out of a long term trend formation:

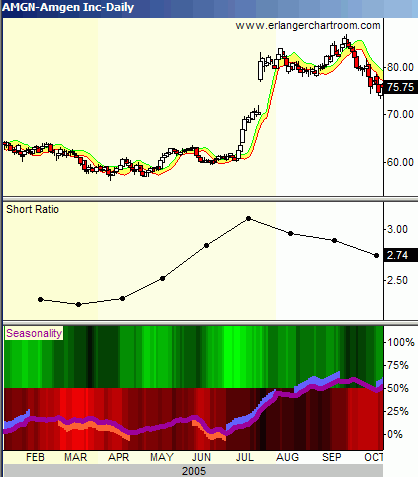
The above chart highlights a recent mover - Amgen (AMGN). In mid-2005, this stock broke out of a long term trading pattern. Of course, you only heard about it after the move began. But add a few advanced analytics from ECR and the opportunity AMGN presented to ECR customers can be seen:

The above chart
highlights two factors that show Amgen was set up for a 3rd Quarter buying opportunity in 2005. The seasonal curve turned up on June 24, initiating a positive seasonal zone. Seasonal heat (the bright green
highlights two factors that show Amgen may be set up for a 3rd Quarter buying opportunity. The seasonal curve turns up on June 24, initiating a positive seasonal zone (positive zones are blue highlighted portions of the seasonal cureve.) Seasonal heat is also very positive. In addition, the short interest ratio swelled significantly during 2005 heading into this positive seasonal period. Clearly these short sellers were either unaware of or were ignoring, the seasonal tendencies of Amgen. In a matter of days from the strong seasonal zone that started on June 24, 2005, Amgen took off, activating a host of short-term trigger indicators. The ensuing “short squeeze” included a huge gap to the upside and peaked 87 days later on September 19, 2005, just days after the completion of the second strong seasonal zone. This action handed the bulls a 40.53% gain.
Going to the Library Has Never Been This Fun or Profitable!
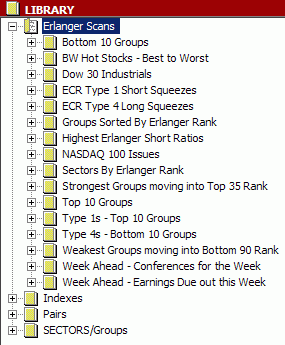
In addition to reviewing stocks, groups and sectors, we have created a place for you to go each day to do your research - the Library. This library is not like any other library you have ever been to- the focus here is on Electronic Chart Books to help you filter through the maze of trading each day.
In the Library you can consult the Erlanger scans for trading ideas based upon the most advanced set of criteria* on Wall Street. You can also track indices, creates thousands of paired combinations to follow, and study details of group and sector action. All in an easy to use interface.
|
 |